Extract structured data from hundreds of documents at the same time.
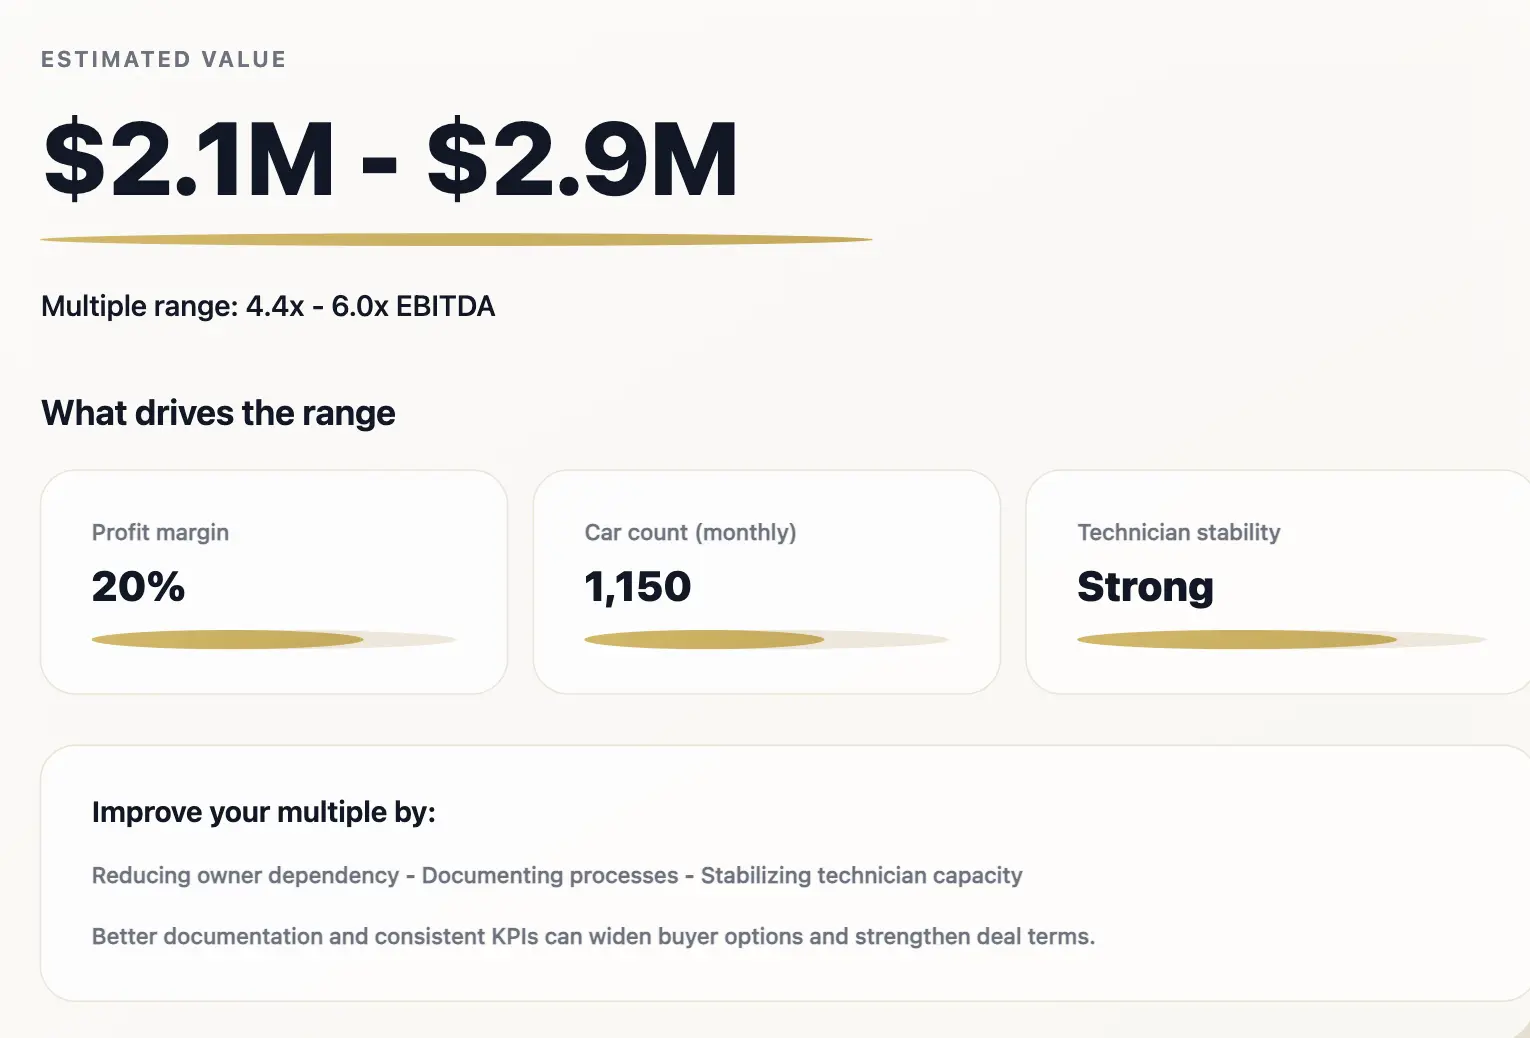
See what serious buyers might pay for your auto repair, collision, or specialty shop - based on how they’re valuing businesses like yours today, not last decade’s rules.
General Auto Repair
From routine maintenance to engine overhauls
Collision & Body
Insurance work, refinishing,restoration & more
Tire & Alignment
Tires, brakes, suspension & wheels
Quick Lube & Express
Oil change, fluids, fast-turn services
Detailing & Specialty
Premium appearance & customwork
1
Enter your revenue
Your last 12 months' revenue, or your best full-year estimate. If you're seasonal, annualize accordingly.
2
Enter your profit
Your approximate EBITDA or owner's take-home. If you don't track EBITDA, estimate what you'd keep after paying a manager to run the shop.
3
Select shop details
Choose your shop type (repair, collision, tire, detailing) and number of locations. These significantly impact valuation multiples.
4
Answer profile questions
Quick questions about your growth trajectory, customer concentration, and how involved you are day-to-day.
5
See your estimate
Get a valuation range reflecting how buyers would likely value your business, plus the key factors influencing it.
6
Decide next steps
Save your estimate, identify improvements, or speak with someone who can provide context.
If you Google “business valuation calculator,” you’ll mostly find generic tools: plug in profit, slap on a multiple, and out pops a number. But auto repair and collision are not generic small businesses:
You’ve got insurance programs, OEM certifications, DRP scorecards, and capacity constraints that live and die on cycle time and technician efficiency.
Real estate is often purpose-built, heavily improved, and subject to zoning and environmental rules that don’t apply to a café or e-commerce brand.
The buyer pool includes national and regional MSOs, private equity platforms, local strategics, and real-estate investors - each looking at your shop through a different lens.
And the market has changed. There was a period when great collision shops could reliably get 100%+ of revenue. Today, quality operations in the $5M+ range can still command strong revenue and EBITDA multiples, but buyers are more disciplined and more focused on fundamentals like DRP performance, margins, and workforce stability.
In the automotive industry, value is shaped by:
There are now thousands of independent shops and a growing number of regional and national MSOs, PE-backed platforms, and family offices actively acquiring. They underwrite deals using EBITDA quality, KPIs, DRP/OEM performance, and workforce stability, not just a flat “4x” rule of thumb.
Collision and many auto service properties are specialized-use: paint booths, lifts, venting, zoning allowances, hazardous materials, parking and access, ceiling height, and workflow layout all matter. Lease terms, assignability, and environmental conditions can significantly impact whether a deal closes, and at what price.
Buyers look at cycle time, CSI/NPS, capture rates, comeback rates, technician efficiency, and gross profit per job along with financials. Shops hitting ~10-day cycle time, 95%+ CSI, 75%+ capture rate, and strong margins consistently see better multiples than those that don’t.
The guide’s operators and bankers are consistent: the best multiples go to shops with low turnover, tenured management, documented SOPs, and a healthy culture, because buyers can trust those businesses to perform after the owner steps back.
A directional estimate of what your auto repair, collision, or specialty shop could be worth in today’s market, based on the same size bands and multiples serious buyers actually use (revenue %, EBITDA multiples, and where businesses like yours typically trade).
A simple explanation of how factors like profit margins, recent growth or decline, customer mix, KPIs, staff stability, and owner involvement tend to move you toward the high or low end of that range.
If you also own your building, we’ll help you think about the operating business separately from the real estate, and how investors typically look at each (income/cap rates, lease terms, environmental issues).
A plain-English view of which buyer groups (local operators, regional MSOs, PE-backed platforms, family offices, real-estate investors) are typically interested in shops at your size and profile — and how their pricing expectations differ.
Suggestions tailored to your situation, whether you’re just curious, planning an exit in a few years, or already talking to potential buyers.
Here’s what’s happening behind the scenes, in the same way a serious buyer would think about it.
First, we ask for:
- Your annual revenue (ideally your last 12 months)
- Your profit, as EBITDA or a best estimate of what you take home from the business.
Under the hood, we treat this as normalized EBITDA, the way buyers look at earnings when they recast your financials:
- Stripping out personal expenses (family vehicles, non-business travel, non-essential perks).
- Resetting owner and family wages to a market salary.
- Excluding one-off items (large, non-recurring costs or windfalls) that won’t repeat.
That gives us a starting point for “how much cash this shop actually throws off” in a way a buyer would accept.
Next, we use your revenue and normalized EBITDA to place your shop into a size band. Size matters because different buyers focus on different deal sizes and pay different multiples.
In collision and higher-ticket auto service, the market today roughly looks like this:
Smaller shops (~$1–5M revenue)
These often trade around 30–70% of revenue or 3–5x EBITDA, with the exact number heavily influenced by profitability, DRP/OEM work, location, and risk.
Mid-sized operators (~$5–15M revenue)
Often see 60–90% of revenue or 4–6x EBITDA, especially if they have multiple locations, stable management, and strong KPIs.
Larger / platform-level groups ($15M+ revenue, $2M+ EBITDA)
Can reach 80–120% of revenue or 6–10x EBITDA, and sometimes higher in competitive processes when strategic buyers or PE platforms are chasing the same asset.
General auto repair, tire, quick lube, and specialty shops follow the same pattern, even if the exact ranges differ by segment and market: as scale and EBITDA grow, your buyer pool expands and your multiple band usually steps up.
The calculator uses these bands to establish a baseline range before any quality or risk adjustments.
Within your size band, we then move your estimate up or down based on the same levers buyers care most about.
Financial strength & margins
If your margins are strong and sustainable, you tilt toward the top of your band:
Shops consistently posting double-digit EBITDA margins (often 12–20%+ in stronger operators) tend to command better multiples than those running low single-digit margins. If margins are weak or volatile, the estimate leans lower.
Recent performance (last 24 months)
Buyers heavily weight what’s happened recently:
If you indicate that revenue and profit have been growing or steady, the model biases you toward the stronger end of the range. If performance has been flat or declining, especially in the trailing 12 months, it pulls you toward the lower end, mirroring how buyers treat trend as a risk signal.
Customer and revenue mix
We also look at where your revenue comes from:
Collision: mix of DRP/OEM program work vs walk-in vs dealer/fleet referrals.
General auto: balance of fleet accounts, recurring maintenance/memberships, and one-off retail jobs.
Heavy concentration in a single insurer, DRP, fleet, or referral source is a risk - so the estimate leans lower when you indicate that one relationship drives most of your volume.
KPIs and operational discipline
Where you provide them, we factor in key operational metrics:
In collision, things like cycle time, CSI/NPS, capture rate, technician efficiency, and comeback rate.
In general auto, analogues like on-time completion, repeat visits, ARO, and comebacks.
Shops operating at or above strong benchmarks (for example, ~10-day cycle times, 95%+ CSI, 75%+ capture, low comebacks) are nudged higher within their band; patchy or clearly below-average performance pulls the estimate down.
People, culture, and systems
We also look at what you tell us about your team and how the shop runs:
Low voluntary turnover and long employee tenure.
Presence of a management bench (someone who can run the shop if you’re out).
Use of documented SOPs and systems instead of everything living in the owner’s head.
These factors reduce key-person risk and increase transferability, so they push your estimate upward. Owner-centric operations with high turnover or no leadership depth are nudged downward.
Red flags and friction
Finally, if you indicate higher-risk situations, such as:
A very weak or expiring lease with no clear path to renewal
Known or suspected environmental problems on the site
Heavy dependence on one customer or program
Significant recent decline in revenue or profit
the model shifts your estimate toward the lower end and may widen the range to reflect that deals like this often clear only with discounts and/or more complex structures (larger seller notes, earnouts, etc.).
If you tell us you own the property, we won’t lump everything into one number.
Instead, we:
- Keep the operating business valuation focused on cash flow and risk
- Give a separate directional view of the real estate, based on how these properties are typically valued - income approach (rent divided by a cap rate appropriate for auto/collision real estate), cross-check against sales comparables and replacement cost where relevant.
We also flag that environmental history, zoning, and use restrictions can materially change what the property is worth and who might buy it.
You end up with two lenses:
“What is my shop worth as a business?”
“What is my building roughly worth as an asset?”
Which is how buyers, landlords, and real-estate investors will think about it in practice.
Finally, we pull all of this into:
- A valuation range for the operating business
- Where applicable, a separate directional range for the property.
We deliberately do not present a single “magic number,” because in real deals:
- The mix of buyers at the table (local operator vs regional MSO vs PE platform) changes what’s achievable.
- Deal structure - how much is cash at close vs seller note vs earnout vs rollover equity - can make one $X offer better than another $X+Y offer with more risk attached.
Your estimate is meant to be: A sober, defensible ballpark for what buyers are likely to pay for a shop like yours today, and a map of the levers (margins, growth, mix, KPIs, team, lease/real estate) that tend to pull that number up or down.
From there, you can use it to sense-check offers, plan improvements over the next 1–3 years, or start talking to people who see hundreds of deals and know which buyers are the best fit for what you’ve built.
When sophisticated buyers look at a shop, they’re not just asking “What’s the EBITDA?” They’re asking:
In collision, valuation frameworks often break into size bands:
$1–5M revenue: ~30–70% of revenue or 3–5x EBITDA.
$5–15M revenue: ~60–90% of revenue or 4–6x EBITDA.
$15M+ platform-level MSOs: ~80–120% of revenue or 6–10x EBITDA (and higher in competitive processes).
In practice, similar logic applies across auto service, collision, and specialty: as revenue and EBITDA cross certain thresholds, your buyer set changes (local operator → regional MSO → PE-backed platform) and so does the multiple.
For every buyer, earnings quality and trajectory are the starting point.
Normalized EBITDA matters more than gross revenue.
Buyers recast your financials to get to a true, sustainable earnings number: stripping out personal expenses, resetting owner/family pay to market, and removing one-off or non-recurring items. Shops with clearly documented, normalized EBITDA are easier to underwrite and tend to command stronger multiples.
Margins and consistency matter.
Operators consistently running double-digit EBITDA margins (often in the 12–20%+ range for healthier collision and auto service businesses) tend to see better valuations than those hovering in the low single digits, even at similar revenue levels.
Recent performance carries extra weight.
Most buyers put disproportionate weight on the last 12–24 months. If revenue and EBITDA are growing or at least stable, you’re more likely to sit toward the upper half of your size band. If they’re clearly declining, expect to be priced toward the lower end or to see more structure (earnouts, seller notes) rather than all-cash at the top of the range.
Most buyers heavily weight the last 24 months, especially the trailing 12. Declining revenue trends pull multiples down; steady or growing performance, even at smaller scale, can command a premium.
Two shops with the same revenue and profit can be valued very differently depending on where that revenue comes from and how fragile it is.
Diversified, repeatable revenue is worth more. Buyers pay up for a healthy mix of DRP/OEM work, fleet accounts, dealer referrals, and walk-in retail, especially when no single program or account dominates the top line.
Heavy concentration is a discount. If 40–70% of your revenue is tied to a single insurer, DRP agreement, dealer, or fleet customer, buyers see key-account risk: one change in program rules or one lost contract can meaningfully hit EBITDA. That usually shows up as a lower multiple, tighter covenants, or more structure in the deal.
Program quality matters as much as volume. In collision, buyers look not just at how much DRP/OEM work you do but at your performance inside those programs (CSI, cycle time, severity mix, repair vs total ratios). Weak metrics can put those relationships at risk, even if the current volume is high.
In summary, more diversified, repeatable revenue and fewer “single point of failure” accounts push you toward the higher end of your range; heavy concentration or obviously risky mix pull you downward.
The highest-multiple deals tend to share two traits:
- Low voluntary turnover and a stable management bench.
- Documented SOPs so the shop runs on process, not just a few key people.
Purpose-built or hard-to-replace sites with adequate square footage, parking, zoning, and environmental compliance are valuable both to operators and to real estate investors. Typical ranges for collision properties can run from ~$750K for smaller, older facilities up to $6–12M+ for large, modern “destination” sites, independent of the business value.
Red flags like heavy owner dependency, high turnover, declining revenue, unresolved environmental issues, or a weak lease position often show up as lower multiples, more structure (seller notes, earnouts), or both.
One theme that comes up repeatedly with auto-repair shop focused buyers we work with is multiple arbitrage - the idea that two $3M shops worth 3x EBITDA individually might be worth 5x together once they look like a small MSO - 1+1=3.
In collision, valuation frameworks often break into size bands:
There are clear thresholds where the buyer universe expands. For example, around $1M+ of EBITDA and 3 - 4+ rooftops in collision. At those levels, platform PE buyers and larger MSOs become serious bidders.
Those buyers can often “afford” higher multiples because when they buy something at 5–6x and fold it into a platform that trades at 13–15x, the value of that EBITDA instantly steps up on their side.
Even if you’re not trying to build a regional MSO, it’s useful to understand how close you are to those thresholds. It changes:
Who is likely to buy you (local operator vs strategic vs platform PE),
How the deal might be structured (straight cash vs seller notes vs equity rollover),
And what kind of multiple is realistic in today’s market.
Our goal with this calculator isn’t to push you into a particular path, but to make those dynamics visible so you can make better decisions: stay independent, partner with a larger group, prepare for a clean exit, or even acquire another store.
While still a controversial idea, some countries are experimenting with AI systems.
Echo AI handles repetitive tasks like drafting contracts and reviewing documents.
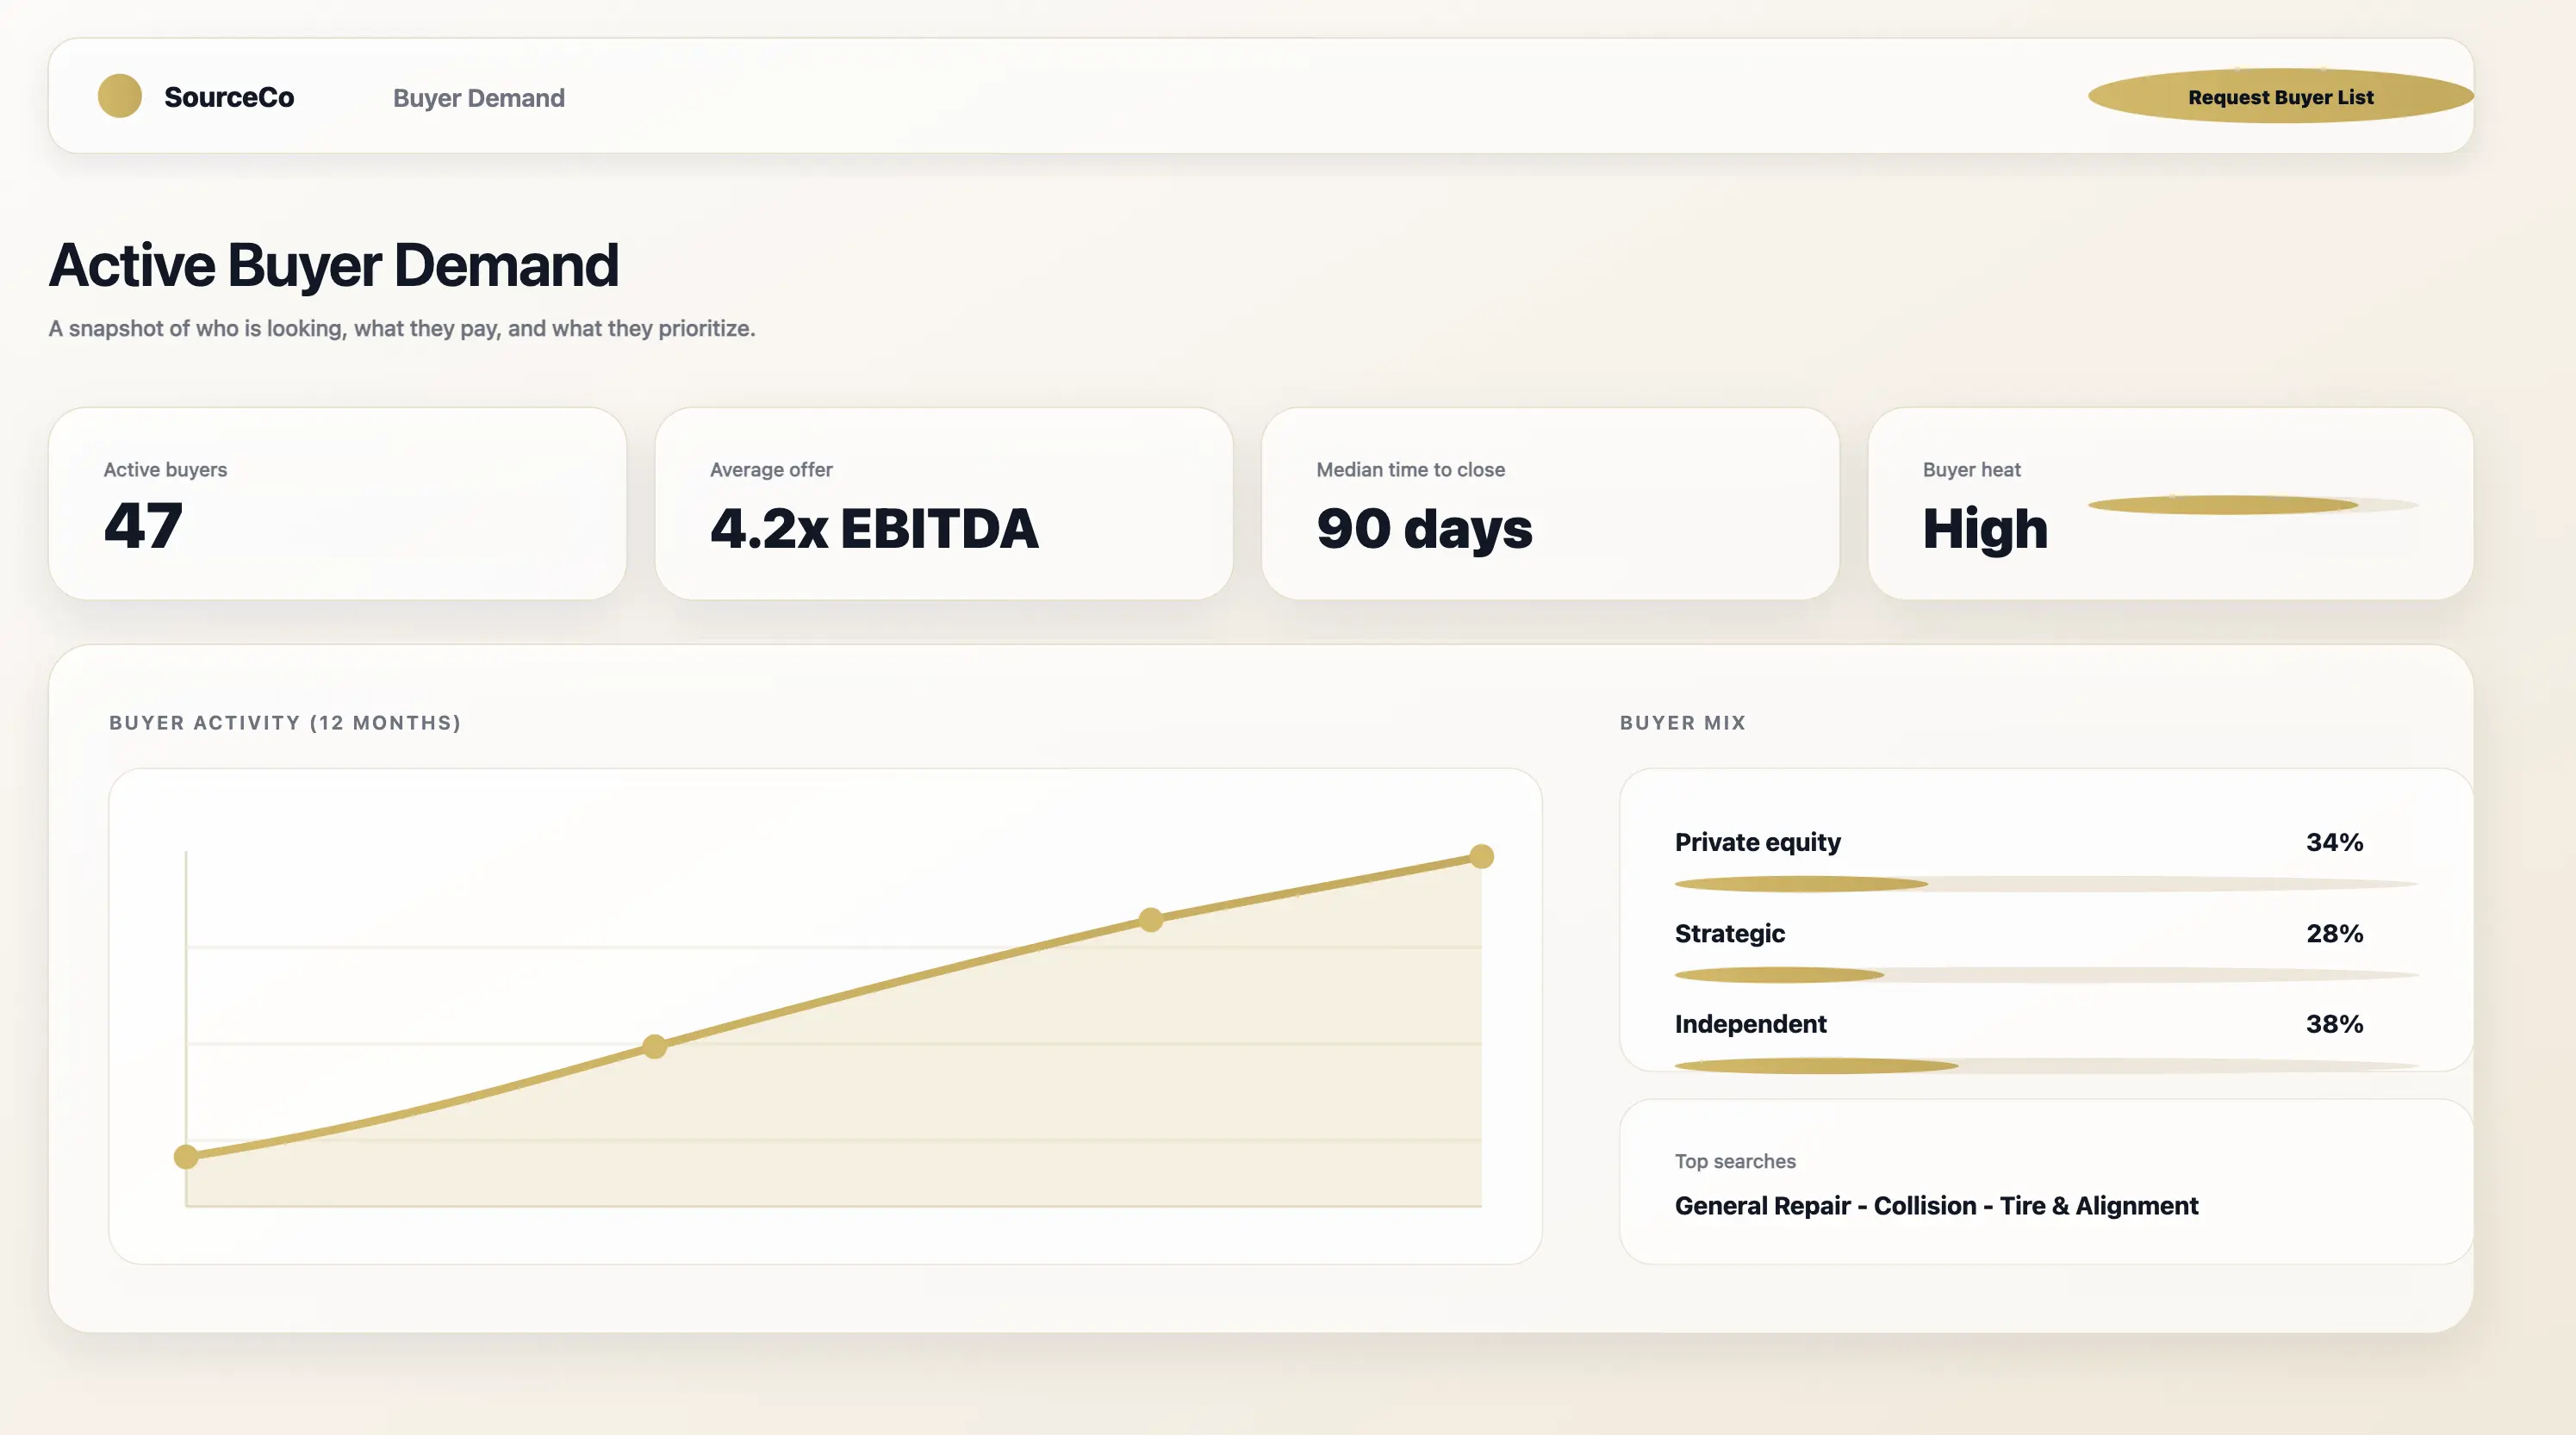
Different buyers see different value. Understanding who's on the other side of the table helps you interpret your estimate and think about positioning.

.png)
National Platforms & Large Consolidators
Large MSOs building national footprints through acquisition
Target Profile
Multi-location operators, strong financials, proven management
What They Focus On
Scale, KPI performance, growth runway, culture fit
Typical Pricing
Highest multiples (4-6x+ EBITDA), but very selective on targets
.png)
Regional MSOs & Multi-Shop Operators
Regional players building density in specific markets
Target Profile
Single or multi-location in their geographic focus
What They Focus On
Market position, customer relationships, facility quality
Typical Pricing
Premium multiples (3.5-5x) for strategic fit, standard otherwise
.png)
PE / Family Offices
Financial buyers creating platforms or adding to portfolios
Target Profile
Larger shops ($1M+ EBITDA) or groups for platform creation
What They Focus On
Financial performance, management team, growth potential
Typical Pricing
Platform deals at premium (5-7x), add-ons at lower multiples
.png)
Local Strategics & Individual Operators
Other shop owners, dealers, or entrepreneurs entering the space
Target Profile
Shops in their area, often smaller deals (<$2M)
What They Focus On
Location, customer base, equipment, real estate situation
Typical Pricing
Market multiples (2-4x), often with seller financing
.png)
Management / Family Buyers
Internal transitions to employees or family members
Target Profile
Any shop where succession is the goal
What They Focus On
Affordability, financing structure, transition timeline
Typical Pricing
Often below market, but certainty and legacy matter more
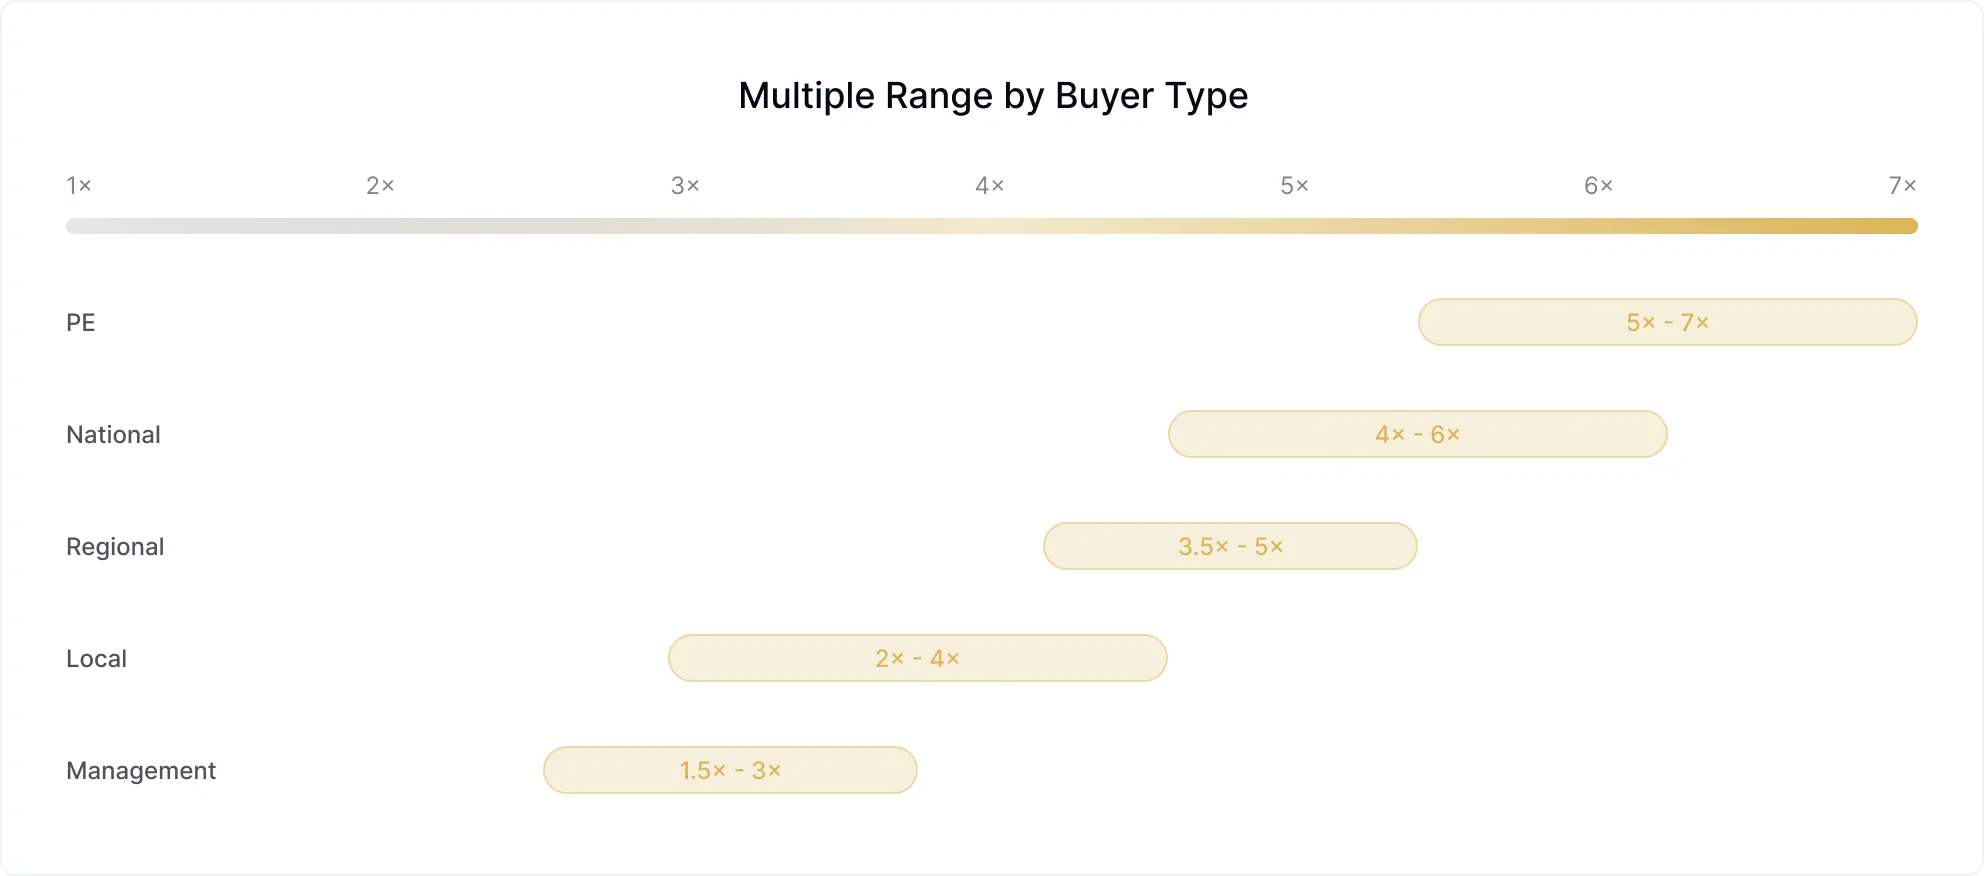
Key insight: Valuation is not "one number." It's a range influenced by which buyer you're talking to. A shop worth 3x to a local operator might be worth 5x to a consolidator filling a geographic gap. SourceCo helps map owners to the right buyer types.
The "price" you hear is rarely what you receive at close. Understanding deal structure is just as important as understanding multiples.
.webp)
.png)
Cash at Close
The portion you receive upfront. Larger deals with stronger financials typically see higher cash percentages.
Typical: 50-80% for larger deals, 60-70% for smaller shops
.png)
Seller Note / Financing
You carry a portion of the purchase price, paid out over 2-5 years. Very common in local and management buyout deals.
Typical: 20-40% is standard for single-location deals
.png)
Earnout
Additional payments tied to future performance metrics. More common in larger deals or when there's uncertainty about projections.
Typical: 10-25% of total consideration, tied to EBITDA targets
.png)
Rollover Equity
You retain ownership in the combined entity. Common when selling to PE-backed platforms who want owner alignment.
Typical: 10-30% for platform deals, rare in local acquisitions
Key insight: A "higher price" with a big earnout and long seller note might actually be worth less than a slightly lower all-cash offer. Always look at deal structure holistically, not just the headline number.
Different exits mean different valuations, structures, and outcomes. Here's the landscape.
Sell 100% to a Strategic Buyer (Local, Regional, or National)
Sell to another operator, competitor, or someone entering the industry. Classic "main street" M&A.
Who is this for
.png)
Owners who want a clean exit with strong cultural continuity
.png)
Shops with stable teams, clean books, and transferable DRP / fleet relationships
.png)
Collision centers with strong KPIs (cycle time, CSI, capture) or general repair shops with repeatable ARO + utilization metrics
types of strategic buyers
.png)
Local operators expanding to 2–8 shops (most active under $1M EBITDA)
.png)
Regional MSOs and strong independents (~$500k - $2M EBITDA range)
.png)
National consolidators (Caliber, Gerber, Classic) competing for larger or KPI-strong shops
Pros
.png)
Typically highest % of cash at close
.png)
Cultural continuity for teams
.png)
Cleanest personal transition
Cons
.png)
Can come with tight integration requirements, especially in DRP-heavy collision
.png)
May require you to stay for transition (3–12 months)
Valuation impact: Competitive markets see better pricing; limited buyer pools can suppress multiples
Sell to a Private Equity - Backed Platform
Sell to a platform building scale - MSOs, PE-backed groups, or strategic consolidators. This is where the highest multiples typically live.
Who is this for
.png)
Multi-location operators or high-performance single shops with $1M+ EBITDA
.png)
Owners open to rolling equity and participating in a second “platform exit"
Why PE-backed companies seek these shops:
.png)
Strong leadership benches
.png)
SOP-driven operations
.png)
KPI excellence (cycle time, CSI, tech efficiency)
.png)
Growth runway (more locations, more throughput)
Pros
.png)
Highest strategic value (scale, synergy, platform upside)
.png)
Opportunity to roll equity and participate in a much larger future exit
Cons
.png)
More sophisticated diligence
.png)
Heavy focus on EBITDA quality, lease + real estate, and management depth
Valuation impact: Highest potential multiples, but most selective - they want specific profiles.
Sell to an Independent Sponsor or Search Fund
Pass the business to children or relatives. Involves emotional, governance, and financial planning well beyond valuation.
Who is this for
.png)
Shops in the $500k–$1.5M EBITDA range
.png)
Strong cultural shops where the owner wants the business to continue “as is”
.png)
Owners open to seller financing, partial rollovers, or creative structures
Why this can be a fit
.png)
Independent sponsors often bring professional management
.png)
Are patient with transition timing
.png)
Offer flexible structures (seller notes are normal)
Pros
.png)
Extreme structural flexibility
.png)
Strong cultural alignment opportunities
cons
.png)
Usually lower headline cash than PE or consolidators
.png)
Heavier involvement required during transition
Valuation impact: Valuation matters for estate planning and buy-sell agreements, but isn't the primary driver.
Internal succession - Management / Employee / Family Buyout
Sell to your trusted team or family. Rewards loyalty and maintains culture, but typically requires heavy seller financing.
who is this for
.png)
Owners with a strong second line of leadership (GM, estimator, service manager)
.png)
Shops where continuity and team preservation are core priorities
Common structures
.png)
Management buyouts with seller financing
.png)
Partial buy-ins over time
.png)
Transition plans spanning 12–36 months
Pros
.png)
Maximum continuity
.png)
Predictable transition
.png)
Often emotionally easier
Cons
.png)
Lower initial liquidity
.png)
Heavier financing involvement (banks + seller notes)
Valuation impact: Price may be lower, but certainty and continuity can be worth the tradeoff.
The right exit depends on your goals, timeline, and what matters most to you beyond price.
See how different shop profiles translate to valuation ranges. Use these to pattern-match against your own situation.
.webp)
These are illustrative composites based on market patterns, not actual transactions. Your situation may differ based on specific factors not captured here. Use these as directional guidance only.
Choose your path based on where you are in your journey. There's no wrong answer.
3+ years out
I’m just curious and not selling anytime soon.
Great, this is the ideal time to understand your levers. The guide emphasizes that many of the best-run shops were not prepping for a sale; they were simply run with investor-level discipline. Key steps:
.png)
Clean up books 18–24 months before you might sell (stop personal expenses, document add-backs).
.png)
Build KPIs into weekly rhythm (cycle time, CSI, tech efficiency, ARO, comebacks).
.png)
Reduce owner dependency by delegating estimating, front office, or production.
Planning ahead
I Might Sell in 1 - 3 Years
Shops getting top multiples have years of clean growth and strong culture you can't fake this in 90 days.
Buyers, especially consolidators and PE-backed platforms, value clean operations, stable teams, documented processes, and predictable KPIs.
.png)
Normalize payroll (move family off payroll or align comp with market).
.png)
Document SOPs so the business runs without you.
.png)
Fix lease issues before going to market (renewals, assignability, terms).
.png)
Address known environmental items early - they become deal-killers late.
.png)
Strengthen management bench (train a GM, or promote a top estimator/tech).
In the market
Actively Considering Offers
At this stage, understanding your buyer pool is more important than optimizing long-term operations.
Your likely lanes depend on your calculator result + profile:
.png)
< $500k EBITDA → local strategics, independent sponsors
.png)
$500k - $2M EBITDA → regional operators, independent sponsors, select PE micro-funds
.png)
$2M+ EBITDA → PE-backed platforms and consolidators (multiple lanes)
Next steps:
.png)
Validate your financials.
.png)
Map buyer universe by geography & strategy.
.png)
Determine best structure (seller note, rollover equity, RE strategy).
These are illustrative composites based on market patterns, not actual transactions. Your situation may differ based on specific factors not captured here. Use these as directional guidance only.
Short, direct answers to the questions collision and auto owners actually ask us and the buyers we work with.
No. This calculator gives you a directional, market-based estimate, not a formal appraisal, fairness opinion, or tax valuation. Buyers will often perform detailed analyses (DCF, market comps, precedent transactions, real-estate appraisal) when the transaction or financing type requires it. Those processes lean heavily on verified financials, site visits, and supporting documentation.
The goal here is different: help you understand the realistic range buyers are paying for businesses like yours today, using the same frameworks (revenue multiples, EBITDA multiples, quality screens) you’ll see in real negotiations with buyers - all without the cost and friction of a full engagement.
It works for collision, mechanical, and general auto service, with some important nuance. The underlying math, revenue, EBITDA, margin quality, real-estate, equipment, and growth profile is the same across auto service businesses. The guide’s valuation sections are collision-specific, but the way it frames EBITDA tiers, add-backs, and value drivers applies directly to other service-heavy automotive shops too.
What is different is who the likely buyers are and what they value:
- Collision is currently heavily consolidated, with national MSOs, PE platforms, and independent sponsors actively seeking platforms and add-ons often at premium multiples for shops with DRPs, OEM certifications, and strong tech teams.
- General repair and specialty shops (tires, quick lube, etc.) tend to see more local strategic buyers and independent acquirers, with slightly different emphasis (recurring maintenance relationships, bay utilization, property, and local reputation).
The calculator handles both, but we’re transparent that the collision side has more institutional buyer data behind it, because that’s where the consolidation wave (and thus the deal volume) is.
There’s no one number, but the guide gives clear bands for collision that we bake into the model:
1. Smaller shops ($1 - 5M revenue) Roughly 30 - 70% of revenue or 3 - 5x EBITDA, depending on profitability, DRP mix, location, and equipment. Specialty/OE-focused operators can be above that.
2. Mid-size operations ($5 - 15M revenue) Typically 60 - 90% of revenue or 4 - 6x EBITDA, with premiums for multi-shop groups and strong management teams.
3. Platform-level MSOs ($15M+ revenue, $2M+ EBITDA) Often 80 - 120% of revenue and 6 - 10x EBITDA+ when there’s real competition among PE-backed consolidators.
For general auto repair, typical multiples are often a bit lower than the top collision platforms, but the same pattern holds: better margins, stronger systems, and strategic relevance push you toward the top of the range; weaker fundamentals and risk push you toward the bottom.
Not automatically, but it does change how buyers see you.
The guide lays out typical EBITDA margin tiers for collision:
- 10–12% for generalist DRP shops
- 12–15% for efficient DRP operators
- 15–20%+ for specialty or OE-focused shops
- 20%+ for true best-in-class.
Falling below your peer group doesn’t mean your shop is worthless. It usually means:
Some buyers see upside if they can plug you into their systems (process, estimating, parts, throughput).
Others see execution risk and will either pass or pay a lower multiple until the profitability story is more proven.
The calculator will reflect that reality and we use your inputs to surface which levers (pricing, RO size, tech adoption, labor efficiency, DRP mix) typically move shops up a band so you can act before you sell.
It usually adds value and complexity:
- Your operating business is valued one way (EBITDA multiple / revenue multiple).
- Your real estate is valued another way, most often via the income approach: expected rent divided by a market cap rate (e.g., $200K rent ÷ 8% = $2.5M property value).
Buyers and advisors will also look at zoning, parking, signage, and operational restrictions (hours of operation, noise, visibility of stored vehicles), all of which can materially change real-estate value and sometimes even future operating rights.
The calculator will ask a few simple questions to roughly allocate business vs. property value. But if you’re making a decision about selling the building, structuring a sale-leaseback, or keeping the real estate as your retirement “annuity,” it’s worth a deeper, deal-specific discussion.
From the perspective of buyers we talk to, we’re off the absolute peak, but it’s still a strong market for good shops.
National consolidators were previously paying up to 120% of sales at peak - roughly a 12x EBITDA multiple in some cases, which made it very hard for new buyers to compete. More recently, those revenue-based valuations have dipped, narrowing the gap between consolidators and independent sponsors / smaller PE groups.
Translated: The frothiest top-of-market multiples have cooled slightly, especially for generic volume. Well-run, differentiated shops with strong DRPs, OEM certs, and good management still trade very well, because platforms and PE are chasing them.
So the decision isn’t “market good vs. market bad” but rather: Is my business in a condition where I can take advantage of this demand? That’s what the calculator and the rest of this page are designed to clarify.
No. The buyer universe is broader than just the big logos:
- National MSOs / consolidators (Caliber, Gerber, Classic, etc.) for the right profiles.
- PE-backed platforms with strong appetite for $2M+ EBITDA, multi-location operators.
- Independent sponsors & search funds targeting $1–3M EBITDA shops with flexible structures.
- Local strategic buyers (other operators in a 5–50 mile radius) who often care deeply about culture and continuity.
- Real-estate investors who may be more focused on your dirt than your DRP mix.
This calculator helps you understand what your business looks like to that entire ecosystem, then nudges you toward the most realistic lanes whether that’s a consolidator, a local operator, or a creative independent sponsor.
Totally fine, and honestly, you’re still in the right place.
Buyer's perspectives line up on one big idea: running your shop like it could be sold tomorrow is usually the best way to own it indefinitely. Clean books, documented processes, healthy margins, a solid team, and a good facility make the business:
- Easier to run
- More resilient to shocks
- More valuable if you ever decide to sell, bring on a partner, or hand it to family.
This calculator gives you a hard-number lens on how close you are to “investor-grade”, even if your only investor is you.
Transparency about how we build these estimates and what they're good for.
This model blends:
- Live acquisition data from auto repair and collision transactions
- Valuation bands from dozens of completed transactions (revenue multiples & EBITDA multiples by size)
- Operator scorecard metrics (cycle time, CSI, capture, tech efficiency)
- Real-estate and lease considerations (cap rates, lease assignability, zoning constraints)
- Team, culture, and owner-dependency risks (leadership depth, SOP maturity)
- It uses your inputs to place you into the valuation bands buyers actually use, then adjusts up or down based on risk and quality - mirroring how sophisticated buyers underwrite shops.
- Not a formal appraisal
- Not a legal, tax, or lending valuation
- Not a replacement for diligence, site visits, lease review, or environmental evaluation
Owners deserve a fast, realistic, founder-first way to understand what their business might be worth without hiring an advisor, paying a broker, or giving up confidentiality. This model aims to democratize that knowledge.
Whether you're years away from selling, actively exploring, or just curious, the goal is to give you useful information without an agenda. We're not trying to convince you to sell; we're trying to help you understand what you have.
Our estimates are based on market transaction data, buyer conversations, and industry benchmarks for auto service businesses. We aggregate insights from completed deals, buyer feedback, and ongoing market analysis to inform our multiple ranges. Sources include conversations with M&A buyers and advisors active in auto and collision, industry reports, and aggregated learnings from sources like The SourceCo Sessions Podcast.